
Effective cloud monitoring does more than show whether a server is online. Cloud monitoring as a service provides a managed, subscription-based way to observe cloud resources and applications, bringing performance information into a shared view. This visibility helps teams understand what is happening across their environment and spot where an issue may be developing.
When signals are scattered across systems, it can be difficult to trace a slow application or service disruption to its cause. This article explains cloud monitoring and Monitoring as a Service (MaaS), including how metrics, logs, traces, and event correlation work together. It also covers capabilities a service may provide, from tracking infrastructure and application performance to highlighting unusual behavior and helping teams investigate problems with context. The result is a clearer understanding of how monitoring supports informed cloud operations.
Key Takeaways
- Define monitoring coverage across public, private, and hybrid environments so cloud resources and application performance are viewed in context.
- Use rules, baselines, and anomaly detection to distinguish recurring patterns from unusual activity and make alerts more useful.
- Connect metrics, logs, traces, and events to investigate how infrastructure conditions relate to application behavior.
- Assess capabilities such as synthetic tests, real-user monitoring, and cost visibility against the operational outcomes that matter most.
What is cloud monitoring?
Cloud monitoring measures and presents the health and performance of cloud infrastructure, workloads, and applications. It helps teams connect resource conditions with service availability and user experience.
Observability Across Cloud Environments
Cloud observability combines signals from public, private, and hybrid infrastructure to show how workloads behave. That broader view matters because an application may depend on databases, networks, and compute resources across different environments.
For example, a team can relate database performance in a private cloud to application behavior in a public cloud. Monitoring both application and network performance across the environments gives teams context to investigate issues instead of viewing each resource in isolation.
Real-Time Multi-Cloud Visibility
Real-time visibility brings current performance data from distributed cloud resources into a shared operational view. It helps teams spot changes sooner, particularly when workloads span providers or connect to local infrastructure.
A monitoring setup might track AWS and Azure workloads alongside Google Cloud Platform (GCP) services and Kubernetes clusters. It can also include private-cloud databases and network availability, helping teams relate changes across the stack. A unified view makes it easier to see whether a slowdown affects one service or several connected components.
Cloud Monitoring Cost and Risk
Organizations can manage monitoring costs by focusing data collection on metrics and events that affect business outcomes. Reviewing monitored resources, data volume, and cloud service usage can reveal unnecessary collection and unexpected charges, particularly as demand-driven scaling increases expenses.
Security, privacy, and compliance risks can arise when monitoring data exposes sensitive details or crosses environments with different access constraints. Collect only useful telemetry, control access, and consider where data is stored and how teams retrieve it. In hybrid environments, security, compliance, and data-access limitations can complicate visibility, so account for these constraints when designing monitoring.
What Is Monitoring as a Service (MaaS)?
Monitoring as a Service (MaaS) delivers cloud monitoring through a subscription. A platform collects telemetry and presents it to operations teams. Its value lies in turning signals across applications, infrastructure, and distributed services into timely action, rather than simply storing more data.
Alerts and Anomaly Detection
Alerting uses thresholds, rules, or detected anomalies to flag conditions that may need investigation. An actionable alert can direct attention to a service issue before it disrupts dependent applications.
Baselines help distinguish a familiar pattern from a meaningful change. For example, a server’s recurring daily CPU peak at 85 percent may be normal, while a new increase outside that pattern warrants review. Where AI-based detection is available, it can help identify unusual behavior in telemetry; teams still need useful alert conditions so detected changes lead to appropriate action.
Dashboards and Uptime Monitoring
Dashboards organize monitoring signals into views of service health, resource use, and application performance. A unified dashboard can bring server, database, and application indicators together, helping an operator trace a slowdown across service dependencies.
Uptime monitoring checks whether a website, API, or application endpoint responds as expected. Pair availability checks with response-time and error data so the dashboard shows more than an online or offline status. For example, a reachable application with rising errors may still need investigation.
Custom Events and Alert Noise
Custom events and alerts focus monitoring on conditions that matter to a particular workload. A team might alert on repeated application errors or database latency rather than every change in storage activity. This targeted approach makes alerts more relevant and gives responders clearer context.
Implementation typically involves connecting telemetry sources, defining thresholds or baselines, and routing alerts into the operational workflow. Although MaaS platforms can be set up within minutes, alert quality depends on configuration. Group related events, suppress duplicate notifications, and tune thresholds to normal behavior to reduce noise. Review alert patterns as applications and workloads change.
Metrics, logs, traces, and event correlation
Cloud monitoring combines measurements, recorded events, and request paths to explain how services behave. Free tiers and trials vary by provider, so compare limits on data volume, retention, and integrations before selecting a platform.
Metrics, Logs, and Traces
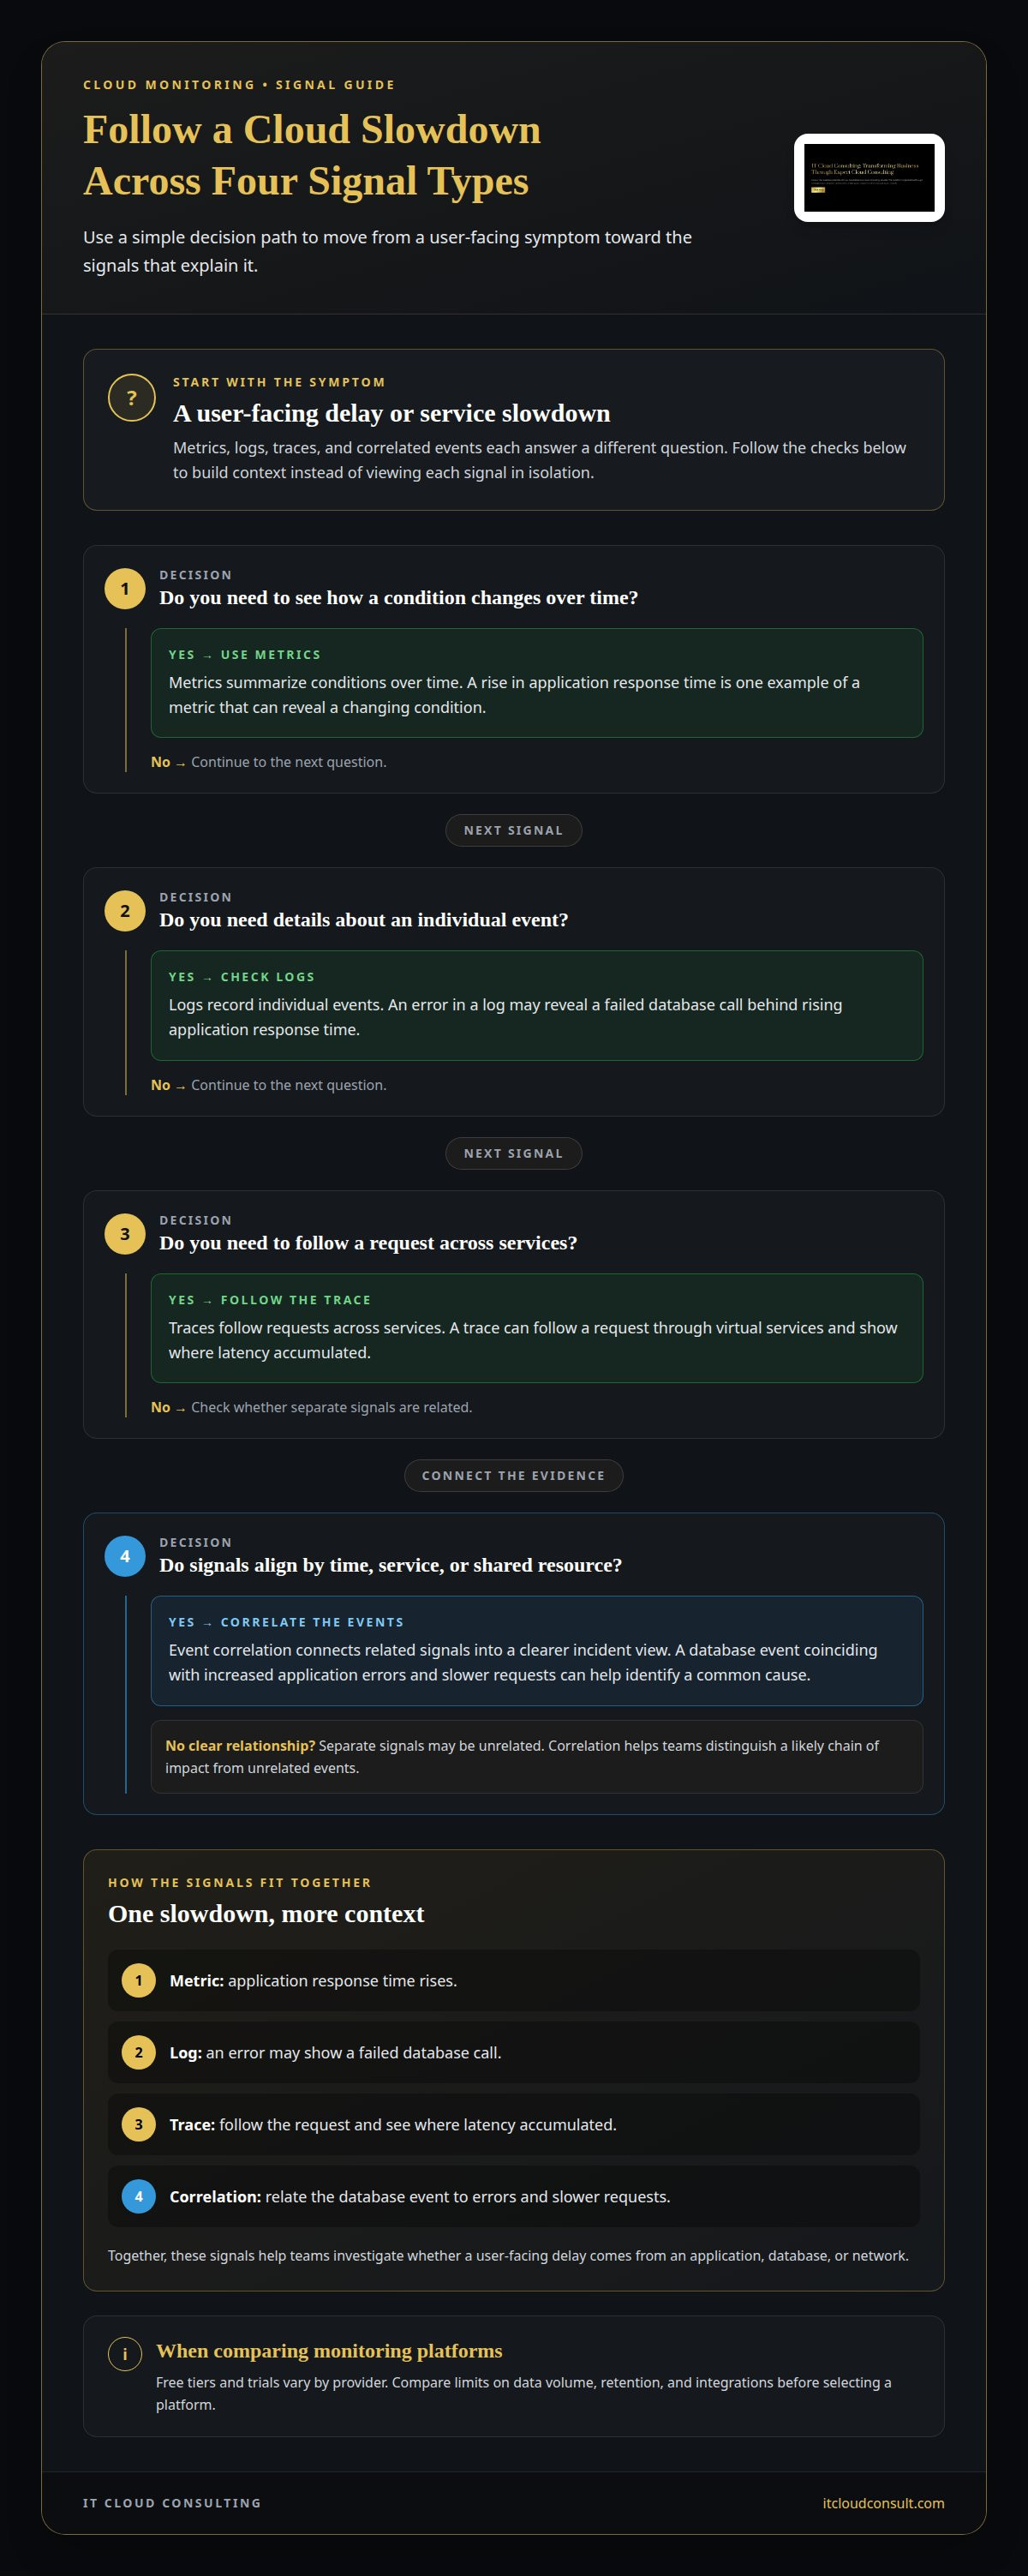
Metrics summarize conditions over time, logs record individual events, and traces follow requests across services. Together, they help operational teams determine whether a user-facing delay comes from an application, database, or network.
For example, rising application response time is a metric, while an error in a log may reveal a failed database call. A trace can follow that request through virtual services and show where latency accumulated. Automated collection makes these signals available for investigation, but each type answers a different question.
Event Correlation
Event correlation connects related signals by time, service, or shared resource, turning separate alerts into a more coherent incident view. This is useful when one failure triggers changes across distributed applications and infrastructure.
If a database event coincides with increased application errors and slower requests, the timing can help teams identify a common cause. A unified monitoring platform can gather data from different sources, making these relationships easier to see. Teams can then distinguish a likely chain of impact from unrelated events and focus their response on the affected dependency.
Custom Cloud Metrics
Custom metrics measure conditions specific to an organization’s workloads, beyond standard CPU, memory, or network indicators. They help teams track business-relevant behavior, such as completed transactions or queued jobs, alongside infrastructure health.
Cloud monitoring tools can combine custom metrics with logs and events from databases, applications, and storage. For example, a team might track order-processing time and compare it with database performance during a slowdown. Choose metrics that clarify service objectives and support action. Collecting every available measurement can obscure the signals that matter.
Cloud monitoring service capabilities
Cloud monitoring platforms combine collection, analysis, and response features to make complex cloud infrastructure easier to operate. Their value depends on how well their capabilities match the services and environments being monitored.
Compare platforms by feature coverage, integrations, and usability. Assess support for servers, databases, applications, APIs, and public or hybrid environments, then consider how the platform connects their data. A web console, API access, unified views, and clear alert configuration can simplify daily operations.
Common capabilities include availability checks, application performance monitoring, database insights, and synthetic tests that simulate user interactions. Real user monitoring shows how actual activity relates to application performance, while server monitoring connects infrastructure signals with service behavior. Some services also correlate telemetry from distributed locations to surface anomalies, likely causes, and operational risks.
For example, a team operating a cloud-hosted website could use uptime checks to identify an outage, error data to locate failing requests, and resource metrics to see whether server capacity is a factor. A platform that scales with infrastructure can extend monitoring as workloads change. Monitoring tools may also provide dashboards through a web console and integrations through an API.
Providers commonly use subscription-based pricing, sometimes letting organizations pay for the systems they monitor. Overall cost depends on the selected scope and usage, including monitored resources and the volume of telemetry collected or retained. Compare these factors before choosing a plan.
For a focused evaluation, map each desired outcome to a capability: availability to uptime checks, user experience to application monitoring, and cost control to service-usage tracking. Then assess whether integrations cover the cloud infrastructure and applications that matter. Discuss cloud optimization to align monitoring capabilities with operational priorities.
IT Cloud Consulting
IT Cloud Consulting helps organizations align cloud decisions with operational priorities through Strategic Cloud Adoption, Cloud Optimization, and Ongoing Cloud Support. When monitoring spans public and private environments, or existing tools leave visibility gaps, strategic guidance can help align cloud capabilities with business needs.
Turn to IT Cloud Consulting when planning cloud adoption, refining cloud resource use, or seeking ongoing support as your environment evolves. A focused discussion can identify how monitoring fits your broader cloud priorities, from improving insight into workloads to supporting informed operational decisions. Contact IT Cloud Consulting to discuss your cloud goals.
Turn Monitoring Insight Into Progress
Treat cloud monitoring as an ongoing part of operational planning, not merely a dashboard to consult during an incident. As applications and workloads evolve, revisit which signals guide decisions, who responds to meaningful changes, and how monitoring supports the outcomes your organization values. This discipline helps cloud monitoring as a service drive deliberate improvements rather than simply adding another stream of alerts.
IT Cloud Consulting can help connect cloud priorities with a practical path forward, whether the focus is adoption, optimization, or ongoing support. A conversation can clarify how monitoring fits into your organization’s broader cloud direction and where to concentrate next. Contact IT Cloud Consulting to discuss your goals and take the next step with confidence.
Frequently Asked Questions
What Common Challenges and Limitations Should You Expect?
Common challenges include fragmented data access, alert noise, and dependence on a monitoring vendor. In hybrid environments, security, compliance, and data-access constraints can make it harder to assemble a complete view. For example, a team may see an application error but lack access to related database telemetry. Clear access controls, useful alert rules, and attention to data portability can help address these operational limits.
What is cloud monitoring as a service and how does it work?
Cloud monitoring as a service is a subscription-based approach to collecting and interpreting signals from cloud systems. The platform gathers telemetry from selected resources, presents it through a shared interface, and can flag conditions that match configured rules or unusual patterns. For example, a team can track an application’s availability and investigate related service events without managing every monitoring component itself.
What metrics, logs, traces, and alerts should a cloud monitoring service track?
Track signals that reveal service health and user impact, such as CPU and memory use, network throughput, response time, uptime, and error events. Logs provide details about individual occurrences, while traces follow requests through connected services. For an online application, rising response time alongside a database error can help responders narrow an investigation. Set alerts for conditions that require action.
How do you choose and set up a cloud monitoring service?
Choose a service by matching its integrations and data handling to your environment, then define what your team needs to observe. Consider scalability, cross-platform integration, data accessibility and portability, and potential vendor dependence. During setup, connect relevant cloud resources and applications, create useful dashboards, and configure alerts around service objectives. A staged rollout helps teams refine coverage and alert quality using actual telemetry.
What are the benefits and limitations of managed cloud monitoring versus self-hosted tools?
Managed monitoring can support faster rollout, reduce maintenance responsibilities, and scale with changing infrastructure. Self-hosted tools generally offer more control and customization but require more internal operational effort. The right fit depends on the control your organization needs, the complexity of its environment, and its capacity to maintain monitoring systems. Teams with specialized requirements may value customization, while others may prioritize centralized visibility and lower overhead.
What security, privacy, and compliance risks apply to cloud monitoring services in the United States?
Monitoring data may expose sensitive details or cross environments with different access constraints. Collect only useful telemetry, control access, and consider where data is stored and how teams retrieve it.


