
A healthy cloud dashboard can still miss the configuration change that triggers an incident. Effective cloud monitoring best practices cover infrastructure, networks, applications, APIs, security signals, and resource use. Track measures such as latency, availability, errors, and utilization, and pair useful alerts with regular checks against approved configurations. This helps teams spot risks and performance issues early.
More monitoring signals do not automatically mean better monitoring. Connect each signal to a business or operational priority, and make sure every alert communicates its urgency and the action required. This keeps teams focused on consequential issues rather than adding noise.
This guide explains what cloud monitoring covers and how to apply it across public, private, and hybrid environments. It also covers practical alert design and configuration-drift detection, helping you build an approach that can evolve with your cloud environment.
Key Takeaways
- Build visibility across websites, storage, databases, applications, and security so teams can connect system signals to user and business impact.
- Bring monitoring data from public, private, and hybrid environments into a consolidated view to make cross-environment issues easier to identify.
- Set alert priorities around severity and business criticality, with clear escalation steps that help teams respond without adding unnecessary noise.
- Compare live cloud settings with approved configurations and investigate unexpected changes to identify drift before it creates wider risk.
1. What Is Cloud Monitoring?
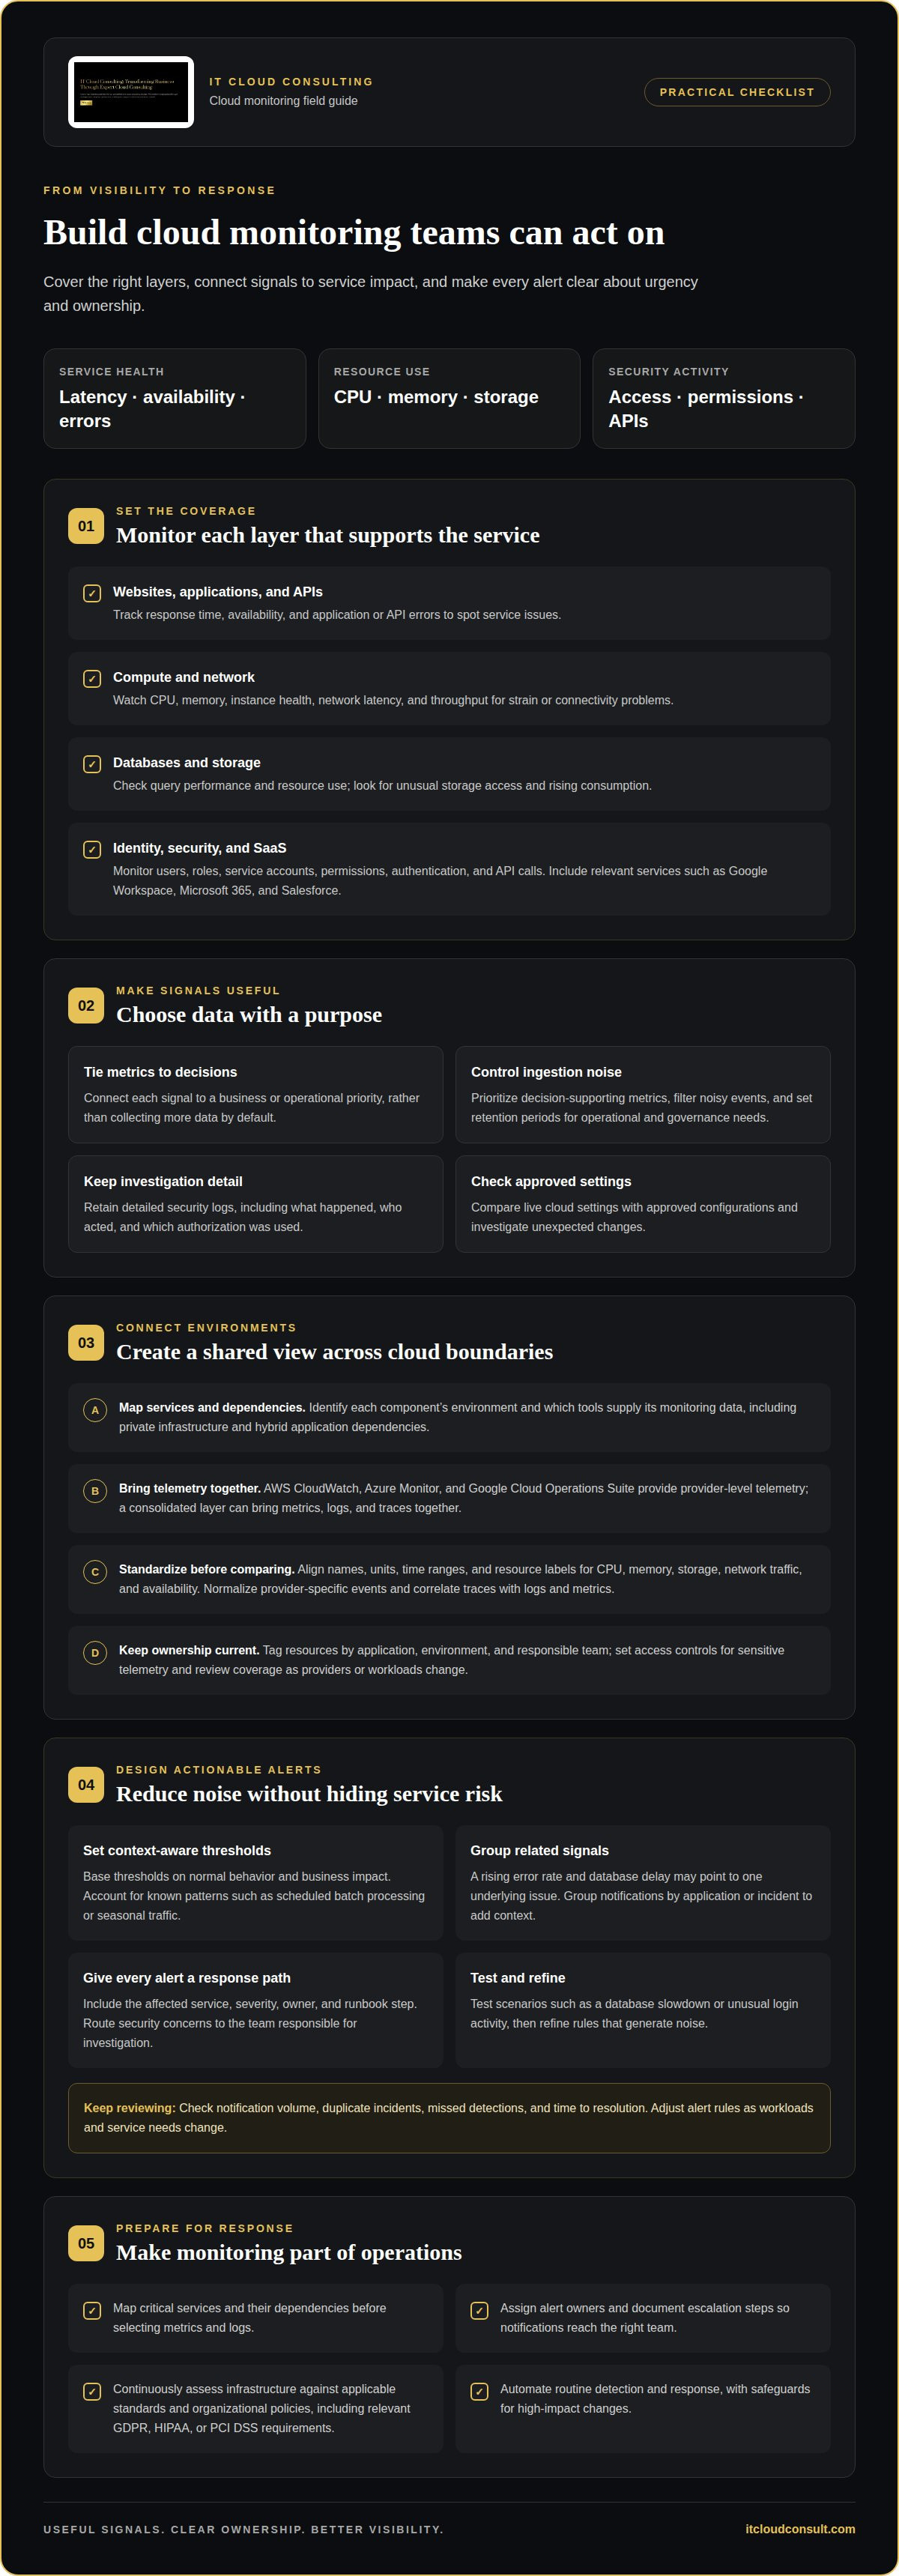
Cloud monitoring collects and analyzes signals from infrastructure, websites, storage, databases, applications, and security systems. Effective cloud monitoring best practices connect those signals to service performance and business priorities. For a website, track response time, availability, and application errors. For databases, monitor query performance and resource use. Storage monitoring can reveal unusual access patterns and rising consumption. Together, these views help teams detect problems before they affect more services or users.
Choose metrics that explain how each layer behaves. Network latency and throughput can expose connectivity problems, while CPU, memory, and instance health show compute strain. Application and API error rates help pinpoint failing functions. Security monitoring should cover users, roles, service accounts, permissions, authentication activity, and API calls. Track permission changes and unusual access to identify potential threats. SaaS services such as Google Workspace, Microsoft 365, and Salesforce can also belong in the monitoring scope.
Cloud-native tools provide direct visibility into a provider’s services, while third-party tools can consolidate signals across providers and technologies. Choose tools based on coverage, integrations, security needs, and your team’s ability to interpret the data. To manage ingestion charges, prioritize metrics that support decisions, filter noisy events, and set retention periods suited to operational and governance needs. Retain detailed logs for security investigations, while avoiding collection without a defined purpose.
To implement monitoring and incident response, map critical services and their dependencies first. Select metrics and logs, define alert thresholds, assign owners, and document escalation steps. Test alerts against scenarios such as a database slowdown or unusual login activity, then refine rules that generate noise. Retain logs showing what happened, who acted, and which authorization was used. For compliance, continuously assess infrastructure against applicable standards and organizational policies, including relevant requirements such as GDPR, HIPAA, or PCI DSS. Automate routine detection and response, with safeguards for high-impact changes.
2. Cloud monitoring across public, private, and hybrid environments
Public, private, and hybrid environments offer different operational views. A public cloud console shows provider-managed services, while private infrastructure may use separate systems and data formats. Hybrid applications can span both environments, making a delay between a cloud database and a private application difficult to trace without shared visibility. Map each service to its environment and dependencies, then identify which tools provide monitoring data for every component.
For multi-cloud coverage, connect native monitoring services to a unified platform. AWS CloudWatch, Azure Monitor, and Google Cloud Operations Suite provide provider-level telemetry. A consolidated layer can bring metrics, logs, and traces together, helping teams follow an application across provider boundaries. NIST describes how a cloud-management broker can collect performance and availability data through native interfaces, then aggregate it for reporting and alerts.
Consistent metrics make combined views useful. Standardize names, units, time ranges, and resource labels for CPU, memory, storage, network traffic, and availability. Normalize provider-specific events before comparing patterns, because identical labels can represent different measurements. Correlate a service’s traces with its logs and metrics to reveal whether a slowdown began in a network path, compute resource, or dependent service.
Build the monitoring model around service ownership and business impact. Tag resources by application, environment, and responsible team, then set access controls for sensitive telemetry. For a hybrid payment application, for example, connect the public-facing service’s signals with its private database dependencies and cloud network path. Review coverage when teams add providers or move workloads, so dashboards and alert routing reflect the current architecture. If cross-provider visibility is difficult to maintain, cloud optimization support can help align monitoring with the environment’s operational priorities.
3. Dynamic alerting and alert fatigue
A centralized dashboard gives operations teams one place to interpret signals across services. Combine real-time alerts for latency, downtime, security events, and resource thresholds, then group related notifications by application or incident. A rising error rate and database delay, for example, may point to one underlying issue rather than separate emergencies. This context helps responders prioritize service impact and act on useful insights instead of switching between tools.
Static thresholds can create noise as workloads change. Set thresholds around normal behavior and business impact, then adjust them for known patterns such as scheduled batch processing or seasonal traffic. A CPU increase during a planned workload may be less urgent than sustained application errors affecting customers. Dynamic rules still need clear limits and ownership, so changing metrics do not conceal genuine service degradation.
Common risks include alerting on isolated metrics, routing notifications to the wrong team, and creating alerts without a response path. These mistakes cause alert fatigue and delay response. Connect each alert to an affected service, severity, owner, and runbook step. For a suspected security threat, include the asset’s sensitivity and business criticality, then route the signal to the team responsible for investigation.
Treat alert strategy as an ongoing process: review notification volume, duplicate incidents, missed detections, and time to resolution. Suppress repeat messages during an active incident, but preserve new evidence that changes its severity. Automate defined, low-risk responses, such as notifying an owner or opening an incident record. Test escalation paths against scenarios such as a service outage, resource spike, or unexpected permission change, and update rules when operations reveal gaps. This supports faster response without ignoring the complexity of cloud systems.
4. Cloud configuration and drift monitoring
Configuration drift occurs when live cloud infrastructure no longer matches its approved state. For example, a network rule changed during troubleshooting may remain broader than intended after the incident. Monitoring should compare deployed settings with a defined baseline and detect changes to access controls, storage permissions, encryption settings, and network exposure. This makes drift an operational signal, not just a documentation gap.
Build the baseline from reviewed configuration files and deployment records. Infrastructure-as-code tools such as Azure Bicep and AWS CloudFormation can make intended settings easier to track. Monitoring tools can compare these sources with live resources and record the changed value, affected asset, and time of change. Assign ownership by application or team so investigations reach people who understand the service’s dependencies.
Not every difference is a threat. A planned database resize may be valid, while an unexpected public storage permission can increase exposure. Classify changes as approved, explainable, or unauthorized, then route alerts according to asset sensitivity and business impact. Preserve configuration history and related activity logs to help establish who initiated a change and whether it followed an approved process.
Use continuous checks to assess cloud configurations against organizational policies and relevant frameworks, including GDPR, HIPAA, and PCI DSS. For multi-cloud estates, normalize findings across providers so teams can identify recurring patterns rather than reviewing separate consoles. Prioritize remediation by security exposure, service importance, and operational impact. Avoid automatic reversion without review, since a rollback can disrupt an intentional update or dependent application. Test detection and remediation workflows as infrastructure changes, then refine them to improve efficiency. For help aligning cloud controls with operational goals, explore cloud optimization support.
IT Cloud Consulting
IT Cloud Consulting helps organizations shape cloud environments around clear operational and business priorities. When monitoring spans multiple providers, generates noisy alerts, or makes configuration changes difficult to trace, a structured review can identify where visibility and governance need improvement.
Through Strategic Cloud Adoption, Cloud Optimization, and Ongoing Cloud Support, IT Cloud Consulting helps businesses plan and evolve their cloud environments. This work connects monitoring decisions with broader priorities, from choosing an approach suited to the environment to improving management of existing resources. The focus is a practical cloud strategy that supports performance, security, and operational efficiency without treating monitoring as an isolated tool decision.
If you’re ready to strengthen how your cloud environment is monitored and managed, contact IT Cloud Consulting to discuss your needs.
Build a Monitoring Practice That Evolves
Monitoring is most valuable when it evolves alongside the systems and decisions it supports. Treat cloud monitoring best practices as an ongoing discipline: revisit whether signals reflect business priorities, whether teams can act on alerts, and whether configuration changes remain explainable as workloads evolve.
Connect monitoring design with your broader cloud direction. IT Cloud Consulting can help your organization assess how its cloud environment is managed and identify opportunities to strengthen its operational foundation. Through Strategic Cloud Adoption, Cloud Optimization, and Ongoing Cloud Support, the work can align technical choices with long-term business needs.
Use the priorities in this guide to shape a focused discussion about your environment and its monitoring needs. Contact IT Cloud Consulting to explore a practical next step, and continue building a cloud strategy with confidence.
Frequently Asked Questions
What Is Cloud Monitoring?
Cloud monitoring is the ongoing collection and analysis of operational data from cloud-based services and their supporting infrastructure. It helps teams understand whether a service is available, responsive, and operating as intended. For example, monitoring an online booking system can connect a failed reservation to application errors, database behavior, or a dependency issue. The goal is actionable visibility, not simply accumulating telemetry.
What are the core cloud monitoring best practices?
Define the most important business services first, then assign each one an owner and monitoring objective. Choose signals that show impact, retain logs useful for investigation, and give alerts a clear recipient and response path. Review the approach after deployments, incidents, or architecture changes. These practices make monitoring more useful by connecting technical observations to decisions teams can act on.
Which cloud metrics should organizations monitor for applications and infrastructure?
Choose metrics that show both service experience and likely causes. Application teams can track response time, request failures, and throughput; infrastructure teams can examine CPU, memory, network latency, and instance health. For a database-backed service, query latency and connection availability provide diagnostic context. Compare these measures over time and across service dependencies to distinguish a localized slowdown from a broader capacity issue.
How should teams set monitoring alerts and reduce alert fatigue?
Make every alert actionable by defining its condition, severity, service owner, and response procedure. Group related signals into one incident when they share a likely cause, and suppress repeated notifications while that incident is active. For instance, an application error and a failing dependency may belong in one alert workflow. Review alerts that prompt no action, then tune or remove them without weakening detection.
What are the best practices for monitoring multi-cloud and hybrid environments?
Use shared resource labels and consistent definitions so teams can compare services across environments. For example, tag a customer-facing application and its dependencies by service name, environment, and owner, even when components run on different providers. Connect provider-native data to a consolidated view while retaining enough source detail to investigate platform-specific behavior. Review coverage whenever workloads move or new services enter the architecture.
How should cloud monitoring dashboards and service-level objectives be designed?
Design dashboards around a team’s decisions, not every available metric. Put customer-facing indicators such as availability and response time beside diagnostic signals, then provide a path to relevant service details. A service-level objective can set a checkout target of completion within 2 seconds, 99.5% of the time. Pair each objective with a clear measurement window and an escalation approach that guides operational response.


